

Why Does a Portable Power Station Never Reach Its Solar Panel's Rated Power?
Why Does a Portable Power Station Never Reach Its Solar Panel's Rated Power?
Technical explainer · November 2026
|
Key takeaways • Getting 120–150 W into the battery from a 200 W panel outdoors is normal: roughly 60%–75% of the rating. Our typical sunny-day estimate is ≈132 W (66%). • The panel is not “short-changing” you. The rating is measured under laboratory Standard Test Conditions (STC) that the field rarely reproduces: weaker light, hotter cells, imperfect angle, and wiring and MPPT losses. • The power station adds two hard limits of its own: an input voltage window and a maximum input power. Wrong wiring can clip power or even prevent start-up. |
1. The rating is measured under laboratory conditions
The “200 W” on a panel label is peak power (Pmax) measured under STC: irradiance 1000 W/m², cell temperature 25 °C, air mass AM1.5. It is a fixed lab benchmark that lets products be compared; it is not a “typical operating condition”.
In the field the gap is large. 25 °C is the cell temperature, not the air temperature; in direct sun cells often run 25–30 °C above the air. And 1000 W/m² is approached only around clear noon with the panel facing the sun. A real output below the rating is therefore physics, not a defect.
2. Six losses: from 200 W to ≈132 W
Figure 1 breaks down the losses for a 200 W panel on a typical sunny day. The values are illustrative engineering estimates (not measurements); the temperature step assumes 55 °C and −0.35 %/°C. Products and sites differ, but the magnitudes and ranking are representative.

Figure 1 Power waterfall of a 200 W panel on a typical sunny day (illustrative estimate)
|
Loss |
Typical effect |
Notes and countermeasures |
|
Low irradiance |
−10% to −30% |
Morning, evening, thin cloud and haze are far below 1000 W/m²; choose an open site and avoid tree shade |
|
Cell heating |
about −8% to −13% |
Temperature coefficient −0.29 to −0.48 %/°C; leave airflow behind the panel, avoid scorching ground |
|
Tilt / orientation |
about −3% to −10% |
Adjust tilt through the day; use a stand to face the sun |
|
Cable & connectors |
about −1% to −3% |
Use adequately sized original or certified cables, keep them short, seat connectors fully |
|
Dust / mismatch / shade |
about −2% and up |
One shaded cell can drag down the whole panel; shade usually matters far more than dust |
|
MPPT & conversion |
about −3% to −8% |
Set by the station's internal efficiency; avoid input voltages that are too low or too high |
3. Temperature: the overlooked loss
The temperature coefficient is the percentage of maximum power lost per 1 °C of cell temperature above 25 °C. A SolarQuotes example: a panel with NOCT 45 °C and −0.45 %/°C loses about 9% at its nominal operating temperature (a 190 W panel gives about 172.9 W). The coefficients it lists range from −0.29 %/°C for a premium panel to −0.48 %/°C.
NOCT is defined at 800 W/m² and 20 °C ambient. Cell temperature can be estimated as: Tcell ≈ Tamb + (NOCT − 20) / 800 × irradiance. At 30 °C air and 1000 W/m², the cell reaches about 61 °C, over 30 °C above the air.
Heat also lowers the panel's operating voltage. Anker likewise notes that hot panels produce less voltage, which lowers output even in full sun.
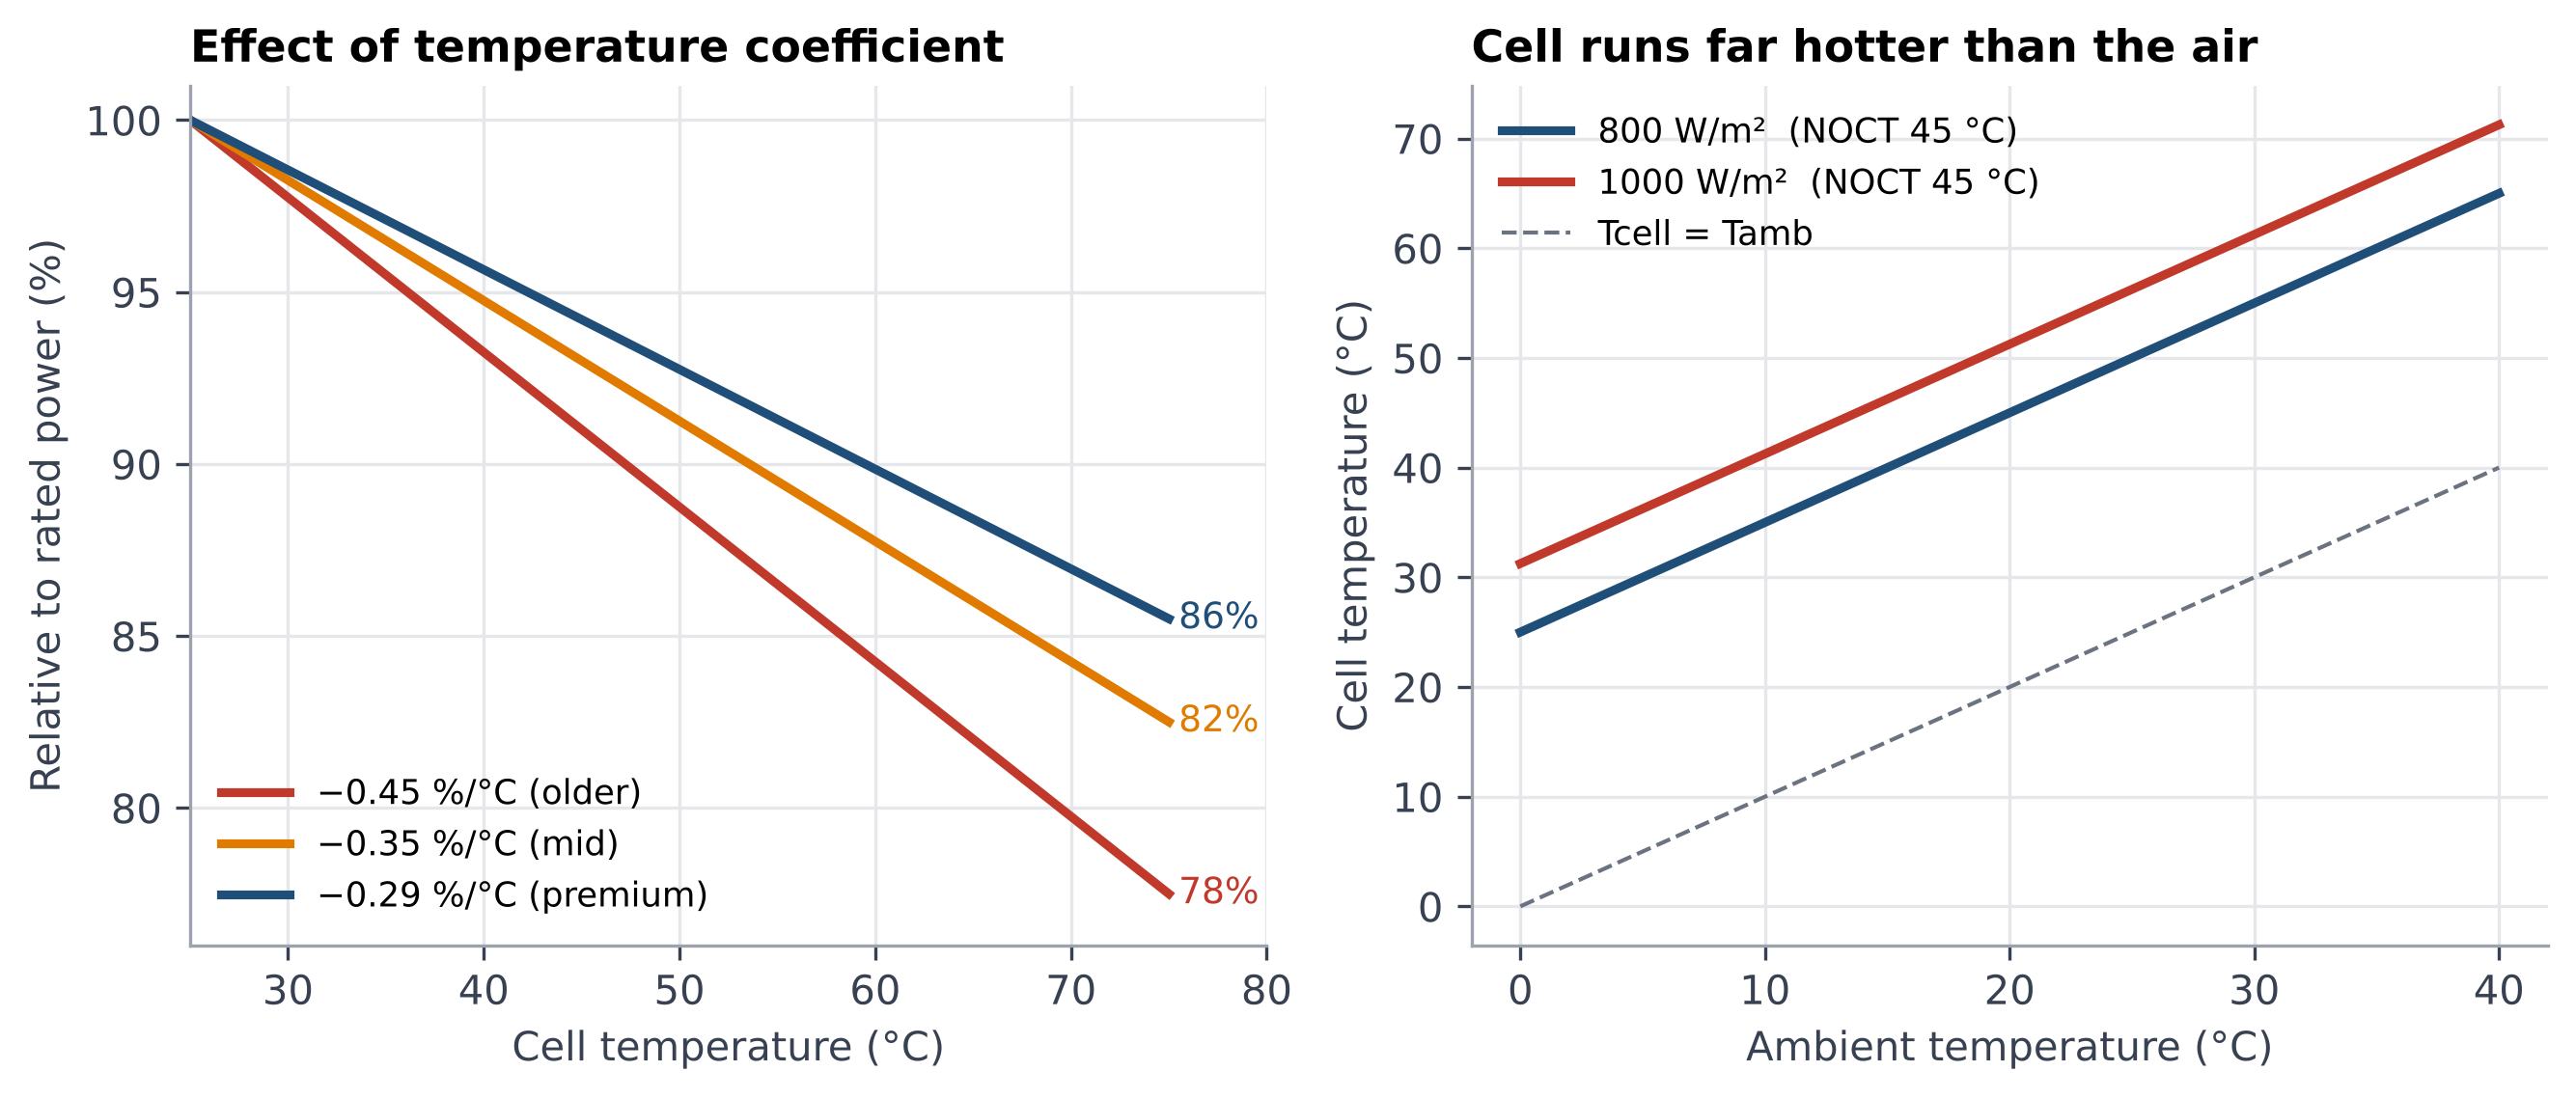
Figure 2 Effect of temperature coefficient (left) and cell temperature versus air temperature (right)
4. Changing light and MPPT: why power keeps moving
Figure 3 uses a single-diode model for illustration: the same panel makes about 202 W at STC, about 177 W (−12%) on a hot sunny day at 65 °C, and only about 91 W at 500 W/m² under thin cloud or oblique light. The voltage of the maximum power point moves with conditions. This is the job of MPPT: it continuously reads voltage and current and keeps the panel near its maximum power point.
Note that MPPT can only find the maximum available under current conditions; it cannot create extra power, and the DC-DC conversion it performs always has some loss.
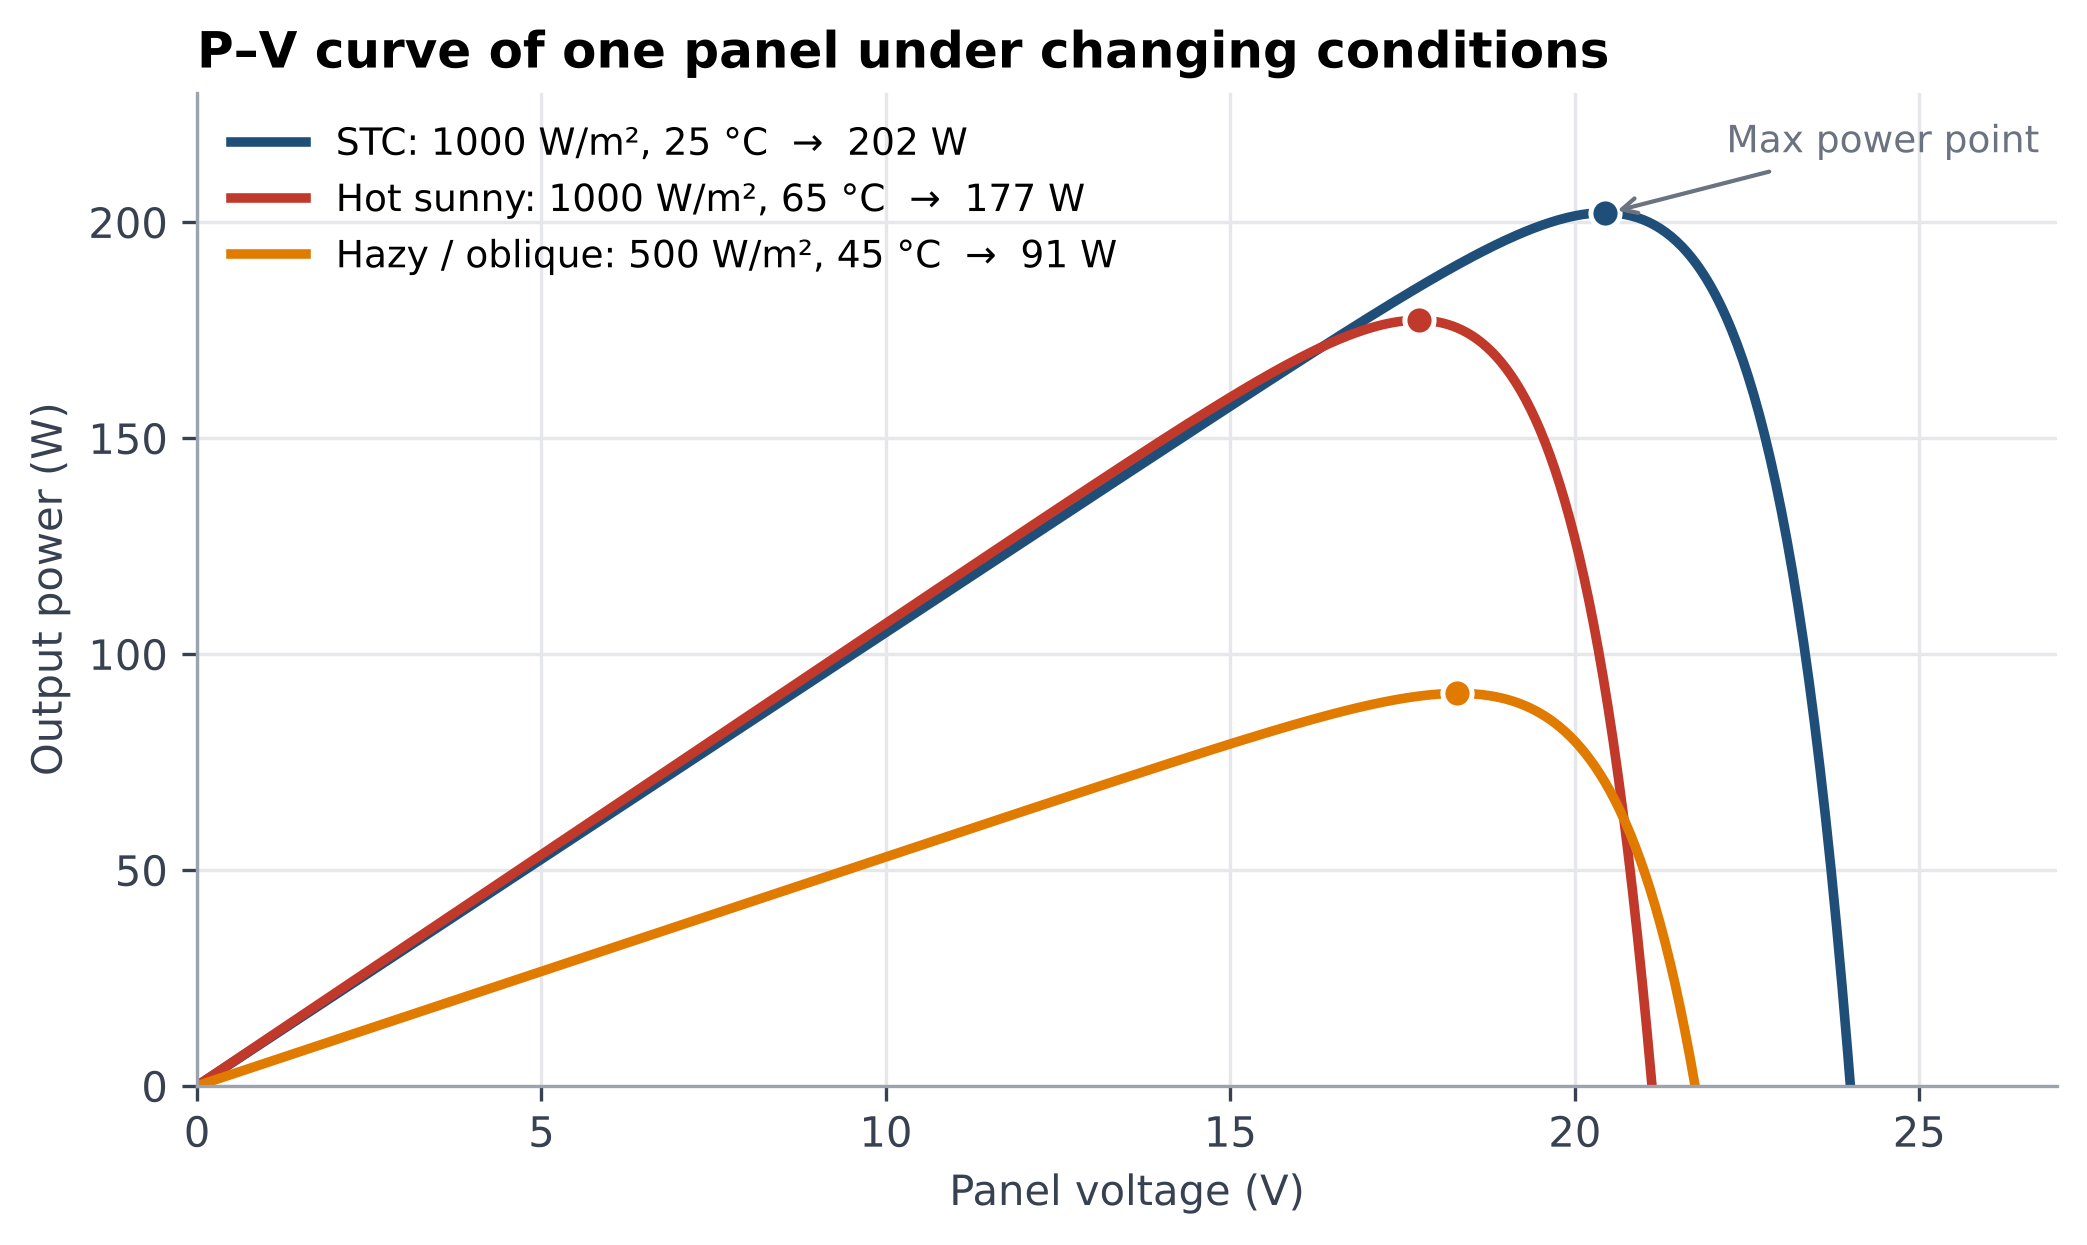
Figure 3 P–V curves of one panel under different conditions (single-diode model, illustrative)
5. Two hard limits of the power station: voltage window and power cap
Input voltage window. Panels in series add their voltages. Take the Anker SOLIX S2000 as an example: its input limits are 11–28 V / 8.2 A or 28–60 V / 12.5 A. Figure 4 uses a 200 W-class panel with about 24 V open-circuit voltage: two in series reach about 53 V when cold, still inside the window; three in series reach about 80 V when cold and exceed it. Anker warns that exceeding the voltage range can damage the unit even if total wattage is fine; when unsure, wire in parallel.
Maximum input power. MPPT caps the input at the station's maximum solar input, and extra panel wattage does not charge faster. For example, the S2000 is 400 W and the F3000 is 2,400 W. Figure 5 illustrates a 1000 W array on a 600 W input: the peak is clipped at noon and about 6% of the day's energy is lost, but morning and afternoon run at full cap, so moderate oversizing is usually still worthwhile.
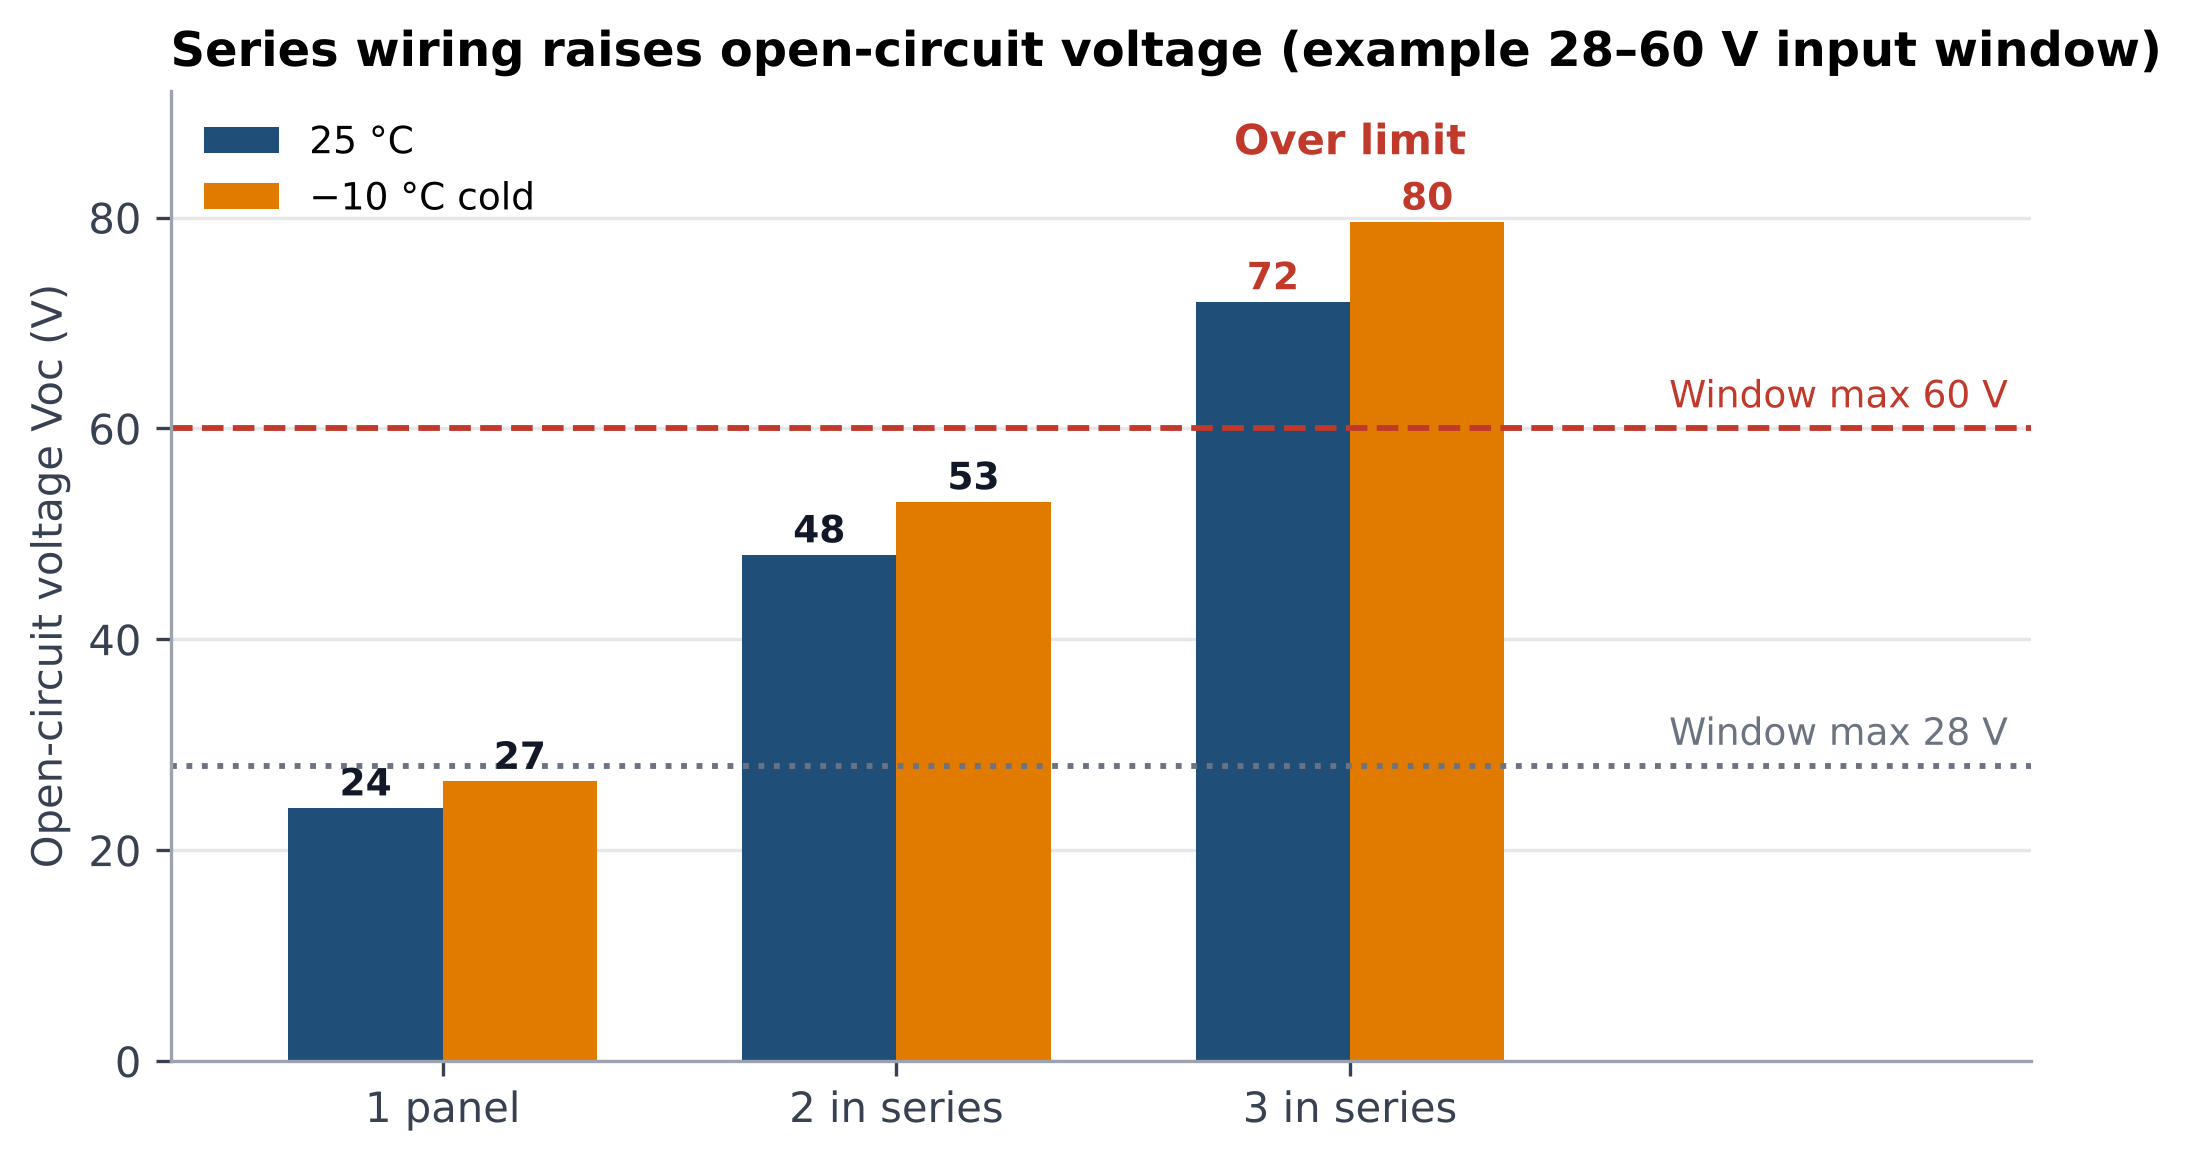
Figure 4 Series wiring raises open-circuit voltage, more so when cold (example window 28–60 V)
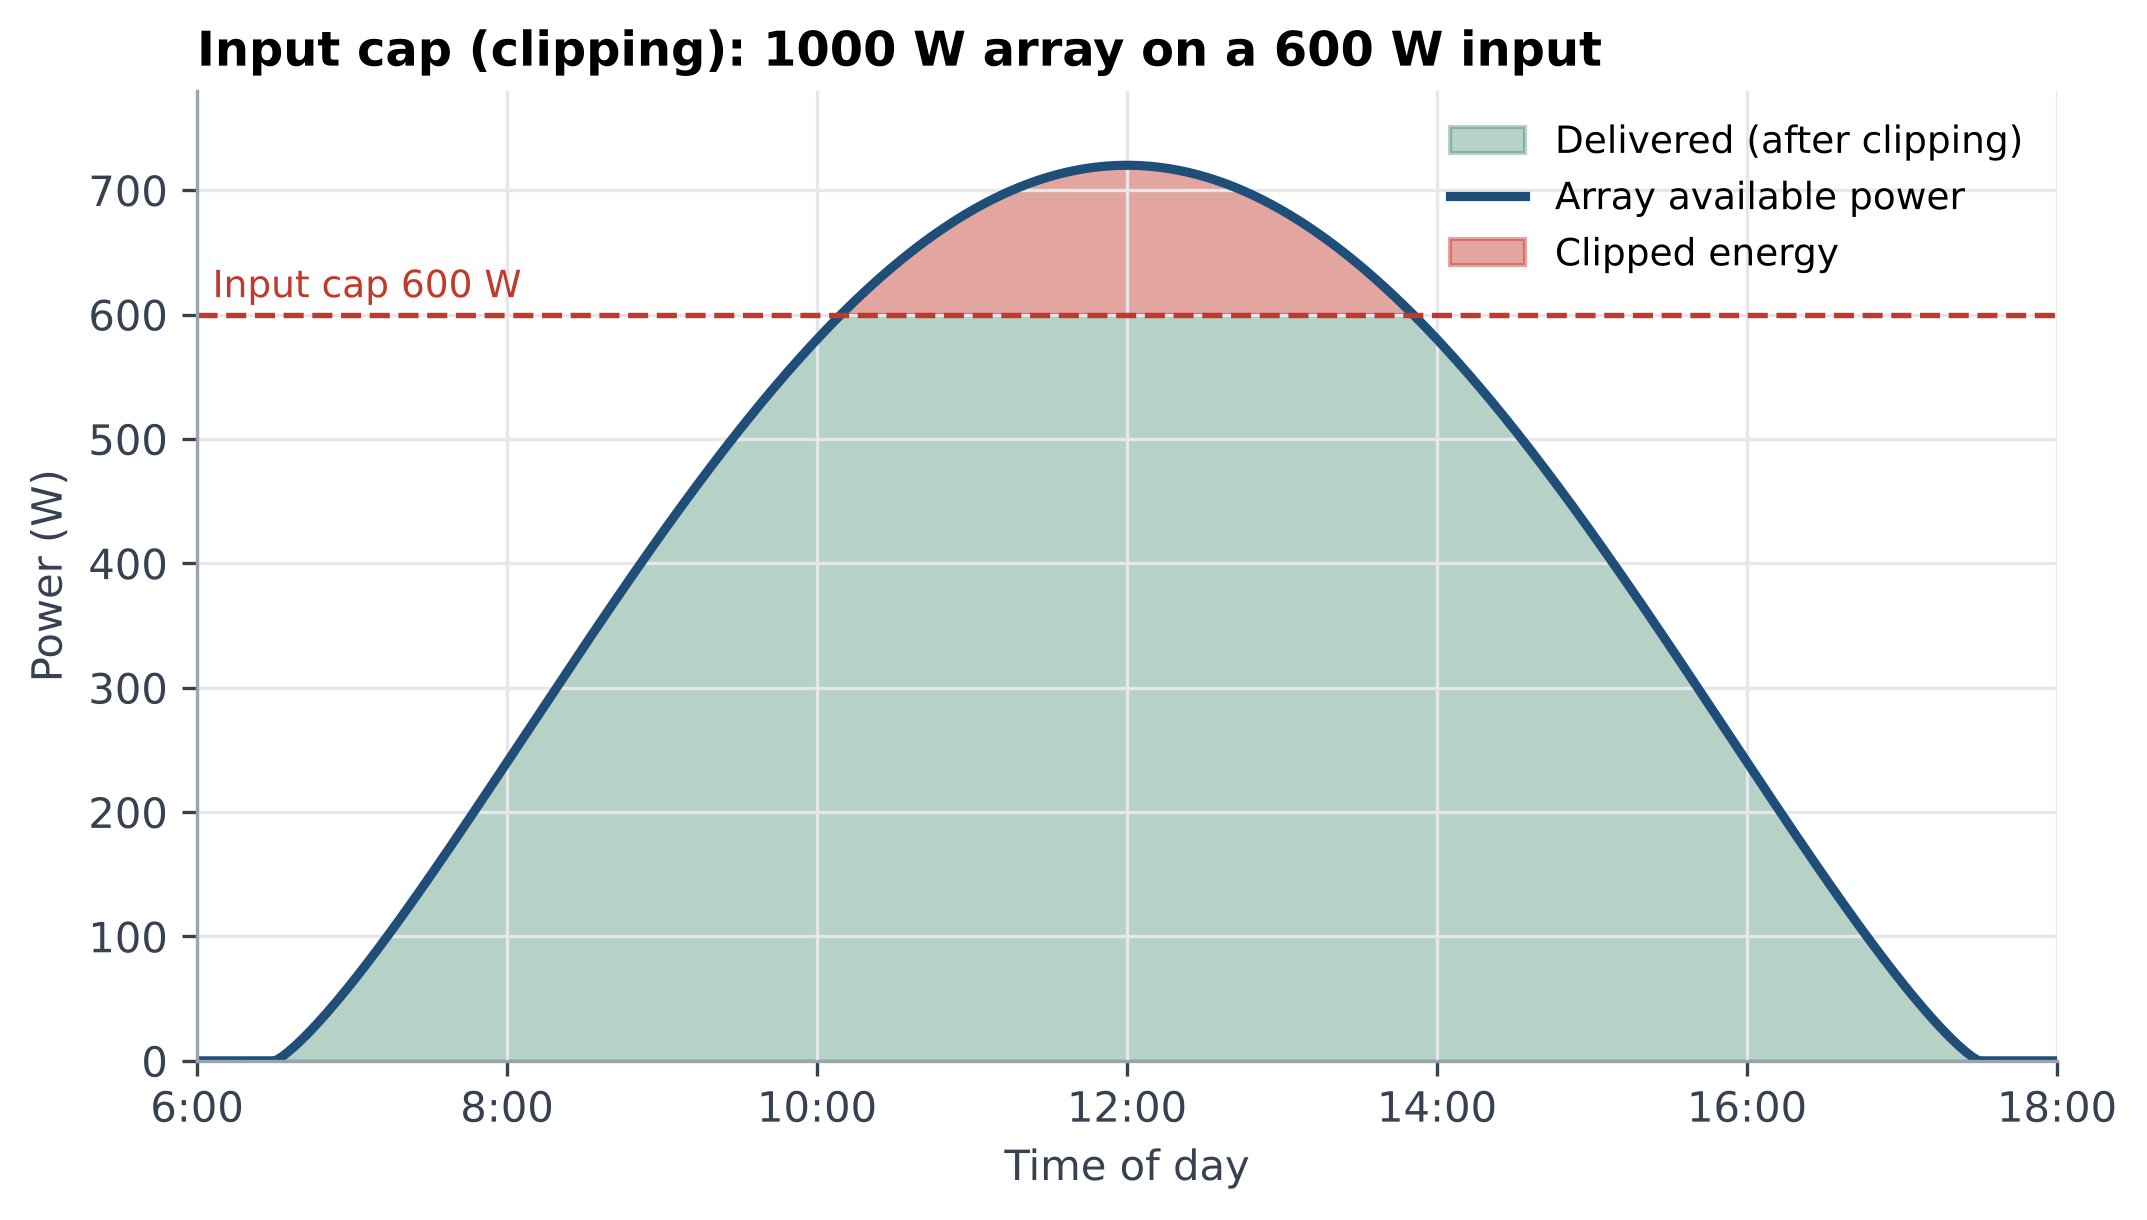
Figure 5 Clipping by the input cap (illustrative: 1000 W array, 600 W input)
6. What is new in 2026
• High-efficiency cells reach portable panels: portable panels with TOPCon cells are already on the market (for example the EcoFlow NextGen 160 W), and the Anker SOLIX PS400 foldable panel is quoted at up to 23% efficiency. Higher efficiency gives more power per area and often a better temperature coefficient, but the rating is still an STC figure and the field still takes its cut.
• Lighter, more compact foldable panels: for example Jackery's SolarSaga 40 Air class of compact foldables. Portability improves, but with small panels, wiring and orientation account for a larger share of the result.
• Higher input caps and multiple ports: newer stations (such as the F3000 and F3800) accept up to 2,400 W of solar input, with several ports and high/low-voltage configurations, so series/parallel layout must be planned against the voltage window.
• Shop by real input, not by rating: check the station's maximum input power, voltage range and current limit, and the panel's temperature coefficient and NOCT power.
7. Practical advice and a sizing formula
Checklist
1. Estimate real input as “rated × 0.65–0.75”. Anker's rule of thumb is ×1.2 for ideal sun and ×1.3–1.5 with clouds, heat, angle and cable loss, which agrees.
2. Check the station's voltage window and current limit first, then choose series or parallel; if unsure, go parallel, and allow for higher voltage in the cold.
3. Ventilate the panel, face the sun, readjust the angle through the day and avoid partial shade.
4. Use adequately sized, short cables and seat connectors fully.
5. An array slightly above the station's input cap (about 1.0–1.3×) improves mornings, evenings and overcast days; going much higher brings little gain.
|
Charging time estimate: hours ≈ battery capacity (Wh) ÷ [rated panel power (W) × 0.65–0.75]. Example: a 2000 Wh station with 400 W of panels needs roughly 6.7–7.7 full-power-equivalent hours, depending on the actual sunshine that day. |
Note: Figures 1–5 are illustrative engineering estimates and models that explain magnitudes and mechanisms; they are not measurements of any specific product. Refer to product datasheets and field tests for exact values.
References
[1] SolarQuotes — How To Read A Solar Panel Specification (Power & Temperature)
[2] Anker SOLIX — Solar charging for portable power station
[3] ZOUPW — Why Solar Panel Output Is Lower Than Rated Power
[4] Jackery — SolarSaga 40 Air
[5] EcoFlow NextGen 160W Portable Solar Panel with TOPCon cells (retail listing)